
Interactive views of the volatility and market-risk indicators we use to evaluate changing conditions.
Market Insights
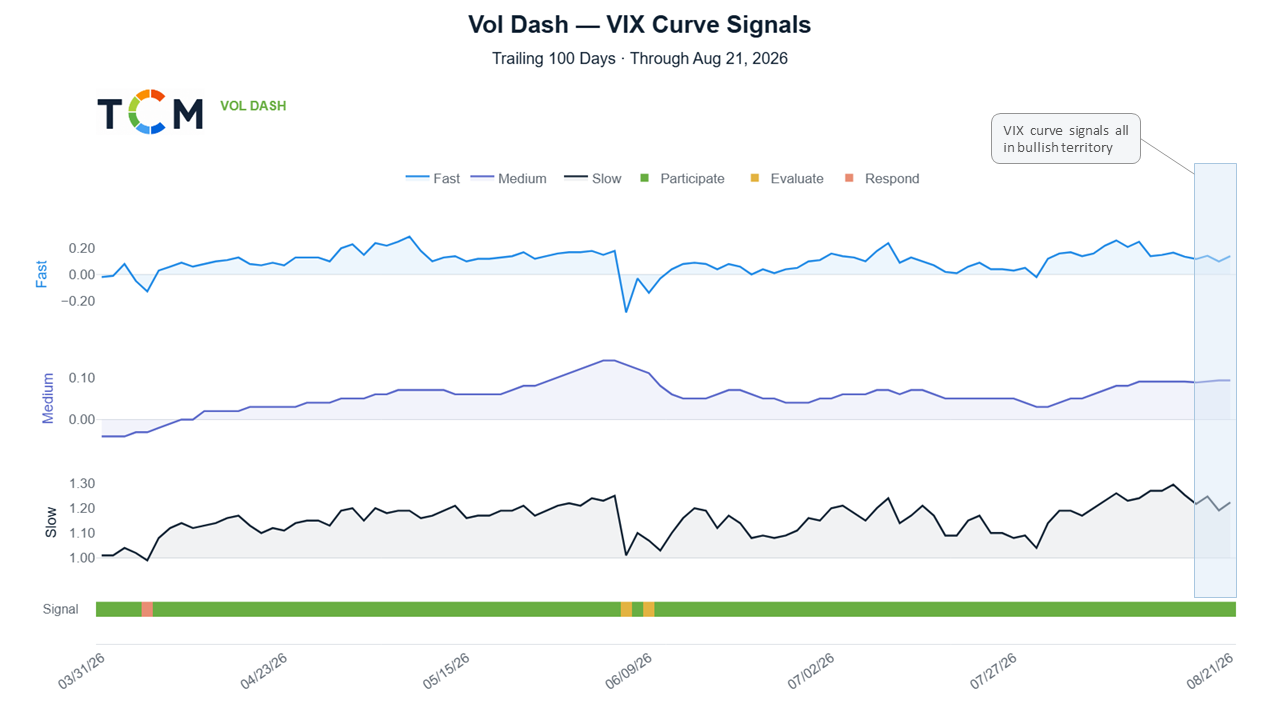
Loading the latest dashboard signal.
The VIX can tell us more than how nervous investors feel today. We believe its term structure, momentum and internal relationships can provide useful clues about how market risk is evolving. Dashboard Signals are designed to listen to that message—helping us identify when conditions may favor participation, when caution may be warranted, and when a more defensive posture may be appropriate.
Dashboard Signals
VIX Curve Signals
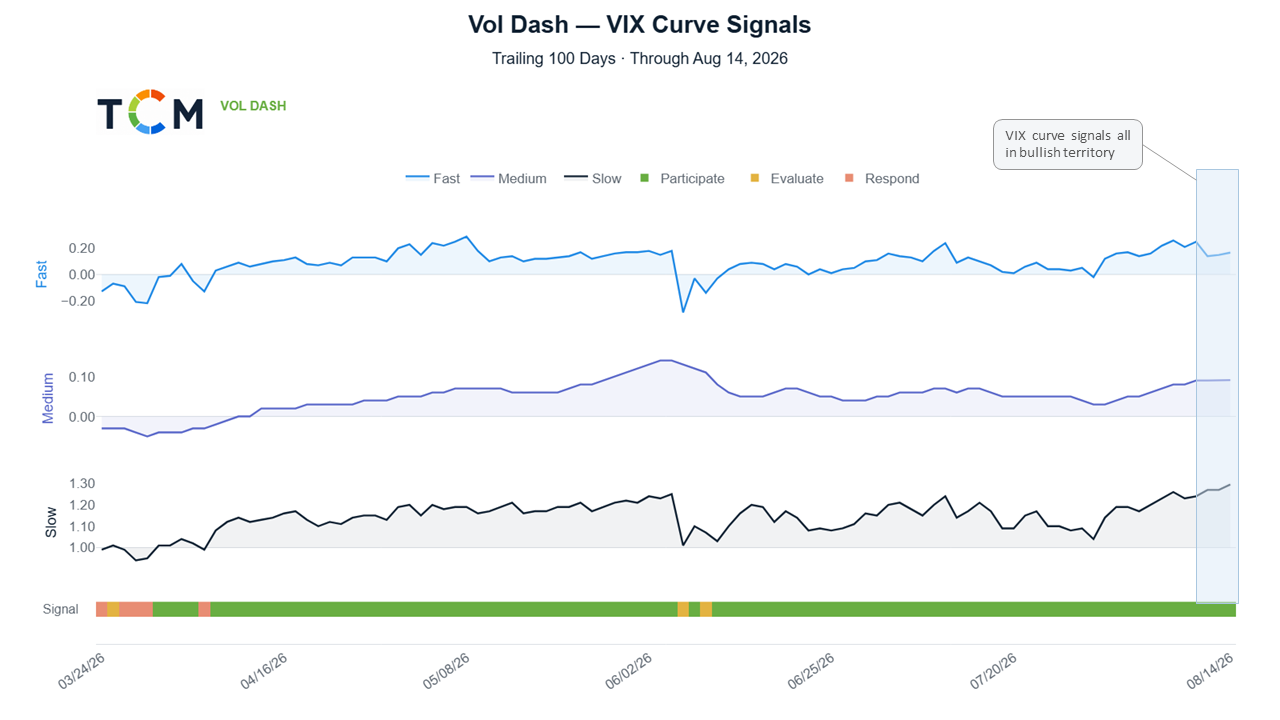
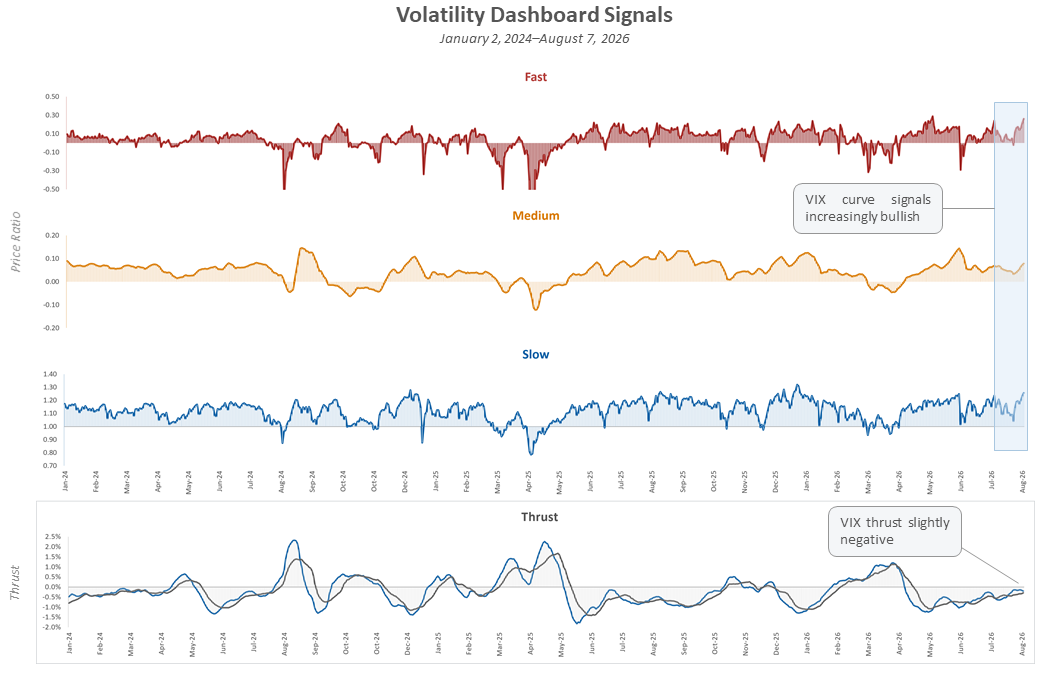
VIX curve signals measure the slope of the Fast, Medium and Slow areas of the VIX futures curve. Together, these readings help us assess the hedging environment and classify conditions as Participate, Evaluate or Respond.
VIX Thrust Signal
VIX Thrust measures the performance of VIX futures relative to the path implied by the VIX futures curve. Positive readings may indicate increasing demand for equity hedges.
Strategy Exposure History
Rather than maintaining a static level of risk, our strategies are designed to adjust exposure as signals strengthen or weaken—providing a clear view of when the process has participated more fully and when it has taken a more defensive posture.
Portfolio Exposure History
TCM Risk Managed Equities strategies adjust market exposure as conditions change. In more stable environments, the strategies generally seek to maintain higher equity exposure. When our Volatility Dashboard identifies elevated risk, exposure may be reduced and tactical hedges may be added.
How to read the charts
- Tactical Beta equity exposure — Net notional S&P 500 exposure.
- Tactical Q equity exposure — Net notional Nasdaq-100 exposure.
- Emerging Markets equity exposure — Net notional emerging markets equity exposure.
- VIX exposure — Tactical volatility exposure added when conditions favor hedging.