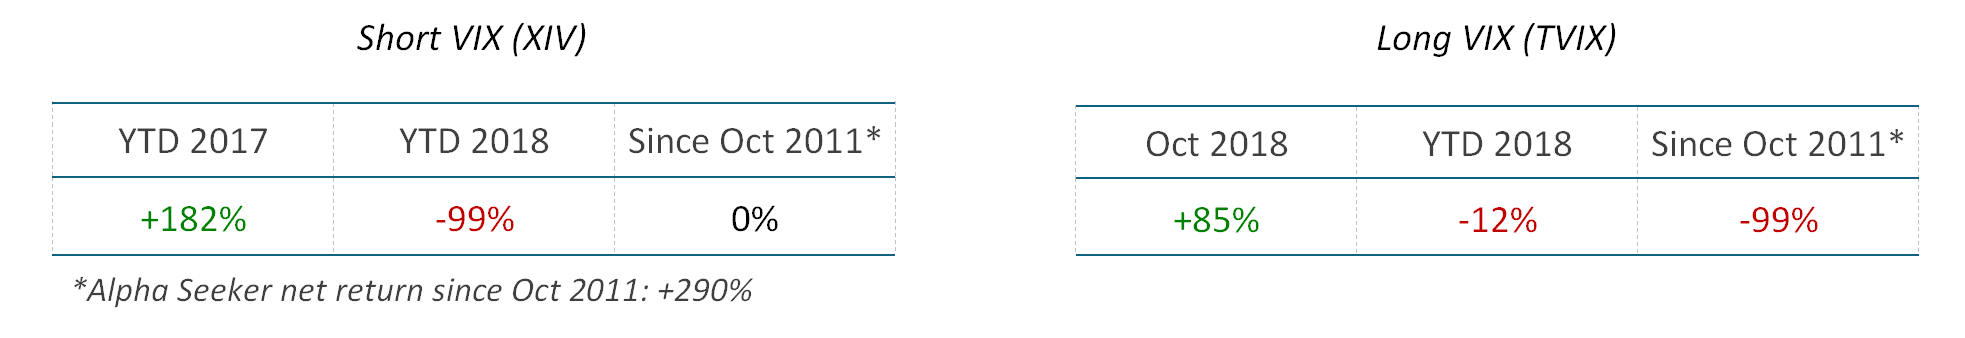

Past performance is not indicative of future results. Smart Index and Alpha Seeker returns from sample accounts, before fees.
a plethora of political potholes
The roller coaster ride continued for markets in November, with several “rips and dips” on headlines around mid-term elections, the trade war with China and a possible softening in the Fed’s hawkish posture on rates. Though a late rally managed to lift the S&P 500 into the green on the month, the index remains mired below September’s all-time high having twice dipped into the red for 2018 in recent weeks.
As investors came around to the idea of sustained weakness in equities, the more logical VIX reactions to S&P moves in November helped produce the outcomes we set out to achieve with our strategies. We were pleased to see Alpha Seeker’s low (14%) daily correlation to the S&P and a reduction in intra-month drawdowns relative to the S&P 500 for both strategies.
A Fed “pause”: be careful what you wish for
The late-November rally in stocks was sparked by a speech in which Fed Chair Jerome Powell hinted that a pause in its rate hike cycle might be closer than markets had previously believed. Looking past the knee-jerk reaction, history suggests that Fed pauses have historically happened around recessions and tops in equities. Rather than an excuse to “keep the party going”, an end to rate hikes is a sign that the Fed no longer views the economy as healthy enough to handle higher interest rates. Once this belief takes hold among CEOs and investors, it can become a self-fulfilling prophecy.

After a near decade-long hiatus, in our view this is now the single most important factor for markets and one that we will be monitoring closely. While recessions and bear markets will certainly cause headaches for passive strategies, they present a substantial opportunity for tactical approaches like ours.