
right back where we started
Shrugging off a deeply inverted Treasury yield curve and basking in the glow of the "Magnificent 7" tech giants, US large cap equity indexes recovered all of 2022's losses with a strong showing in 2023 (S&P 500 +26.4% YTD*, Nasdaq 100 +54.3% YTD) while small cap indexes (Russell 2000 +18.7% YTD) lagged as a result of their exposure to failing regional banks (chart).
In a similar pattern, international markets saw a split between developed market indexes (MSCI EAFE +16.9% YTD) that mirrored their US counterparts while emerging markets exposures (MSCI EM +4.4% YTD) were held back by a struggling Chinese economy.
*All figures as of 12/26/23
Cumulative Performance 01/03/22 - 12/19/23. Source: stockcharts.com. Click for larger image
The 2023 rally was interrupted by two periods that created enough worry to briefly invert the VIX futures curve, first around the failure of several US regional banks in the spring and then again during a sharp yield spike and Middle East war fears over the summer and early fall. In each case, these episodes saw VIX stop short of crisis levels in the spike-and-retreat pattern that usually creates hedging expense for TCM’s tactical risk management approach (chart).
TCM Volatility Dashboard, Jan 2022 - Dec 2023. Source: TCM. Click for larger image
Despite the cost imposed by this two-year long “near-crisis” environment, TCM’s large-cap Risk Managed Indexing strategies (Tactical Beta +15.7% YTD, Tactical Q +40.8% YTD and EAFE Smart Index +8.4% YTD) are now back to early 2022 levels. Of course, “tactical” does not only mean “hedged”- as long as current bullish conditions persist, these strategies can maintain index exposure as high as 120% (i.e., can capture as much as 1.2x the return of the underlying index).
Hypothetical growth of $1000, 2022-2023. Source: TCM, Yahoo Finance. Click for larger image
Highlighting its role as a portfolio diversifier, Alpha Seeker (-1.4% YTD) has improved traditional stock/bond portfolios since 2022, keeping pace with the hedge fund universe (QAI: Hedge Multi-Strategy Tracker) along the way while maintaining its flexibility to quickly morph into a more aggressive long or short beta posture as condtions dictate.
Producing approximately 13% net income in 2023, TCM’s option-income powerhouse Hedged Yield (+3.5% YTD) is on pace to repay invested principal in just 8 years, making this strategy particularly appealing for tax-advantaged accounts with an intermediate to long-term investment horizon. Look for a more in-depth discussion on this strategy coming soon.
Credit Card Nation
As the always-astute analyst Fil Zucchi recently observed, the 2022 bear market and the 2023 rally broke almost all of the rules of the downturns and recoveries of the last 30 years. Defying historical precedent in the face of a deeply inverted treasury yield curve, corporate credit spreads and the VIX have remained placid while the economy and financial markets have bent but not broken.
With the benefit of hindsight, this unusual outcome can be explained by the unprecedented actions of the preceding years that borrowed heavily from the future to front-load support for the three main pillars of the US economy: consumers, government and corporations.
“Debt pulls forward consumption and pushes back the evidence or the recognition of business failure.”
Consumers
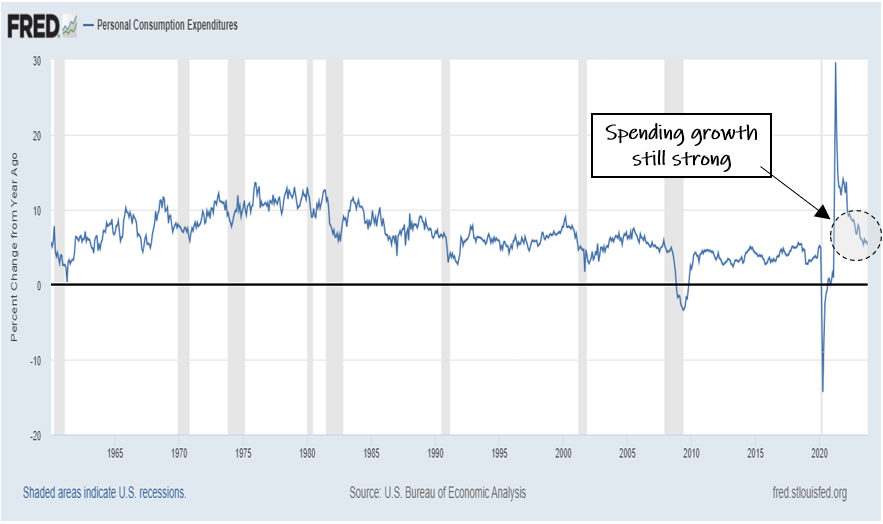
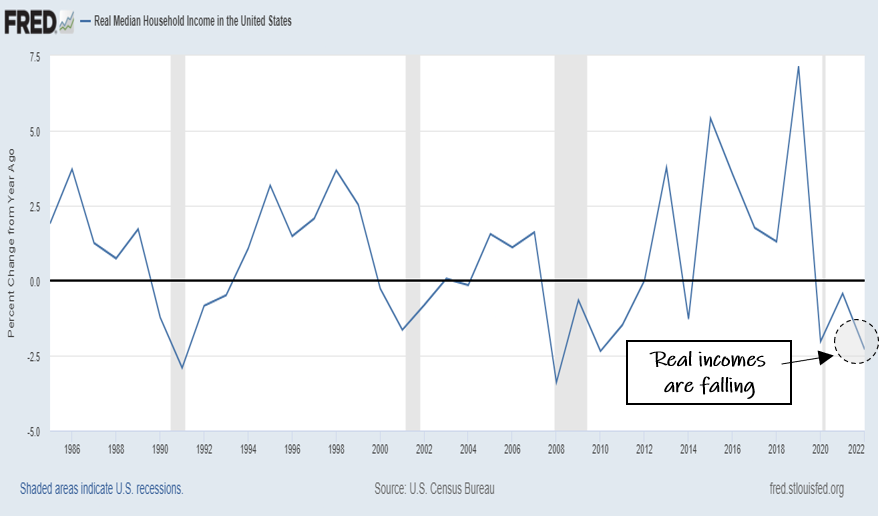
Currently rising at 5% per year, resilient consumer spending has been a major factor supporting US GDP since 2022 (slide 1). Of course, spending is most sustainable when it is financed by income and in the inflationary post-pandemic economy, real (inflation-adjusted) incomes are currently declining at a 2.3% annual pace (slide 2).
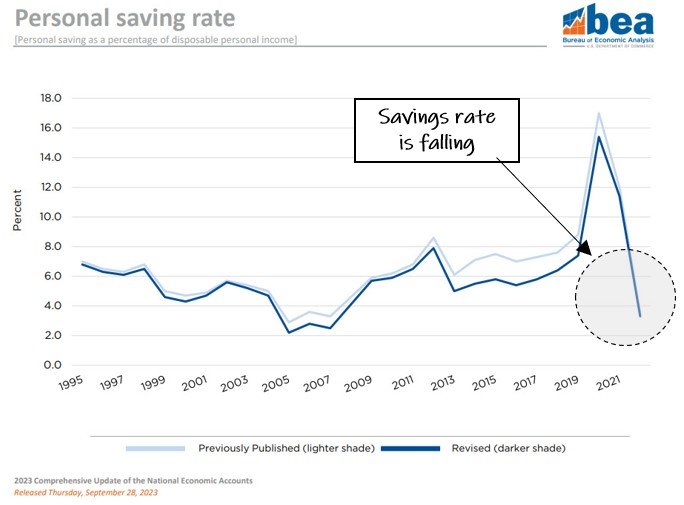
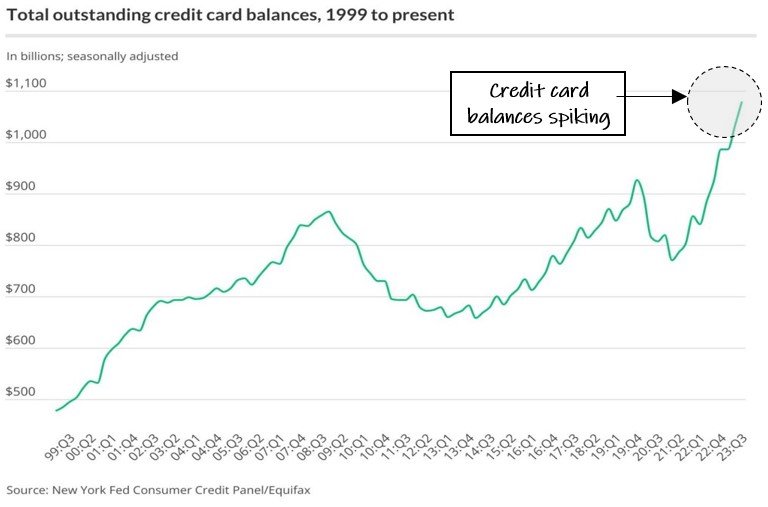
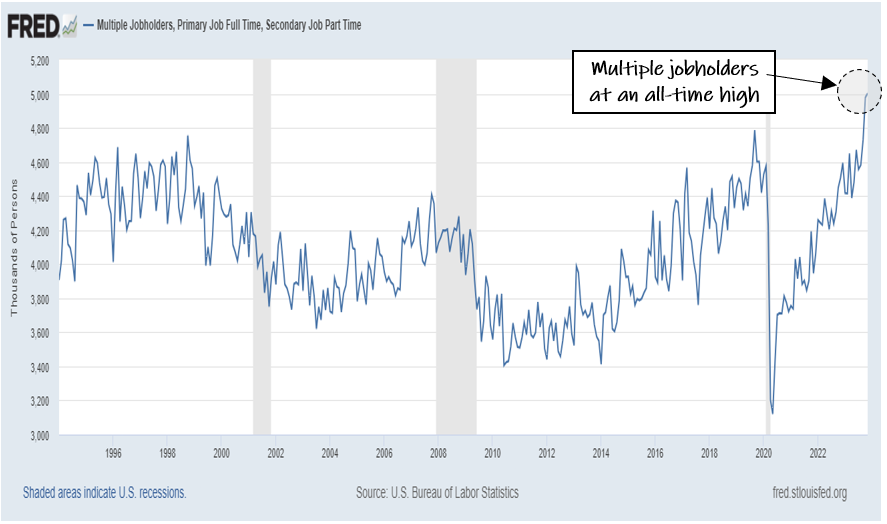
As incomes fail to keep pace with inflation, consumers have increasingly sustained spending by drawing down savings (slide 3), using credit cards (slide 4) or in many cases, getting a second job (slide 5). While a record number of multiple jobholders might boost employment statistics, it hardly reflects a sustainable long-term scenario for US households that are increasingly being drawn into the trap of debt-fueled consumption.
Government
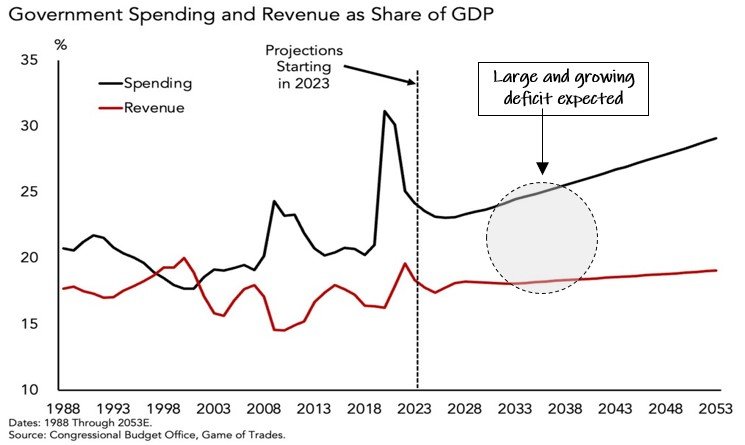
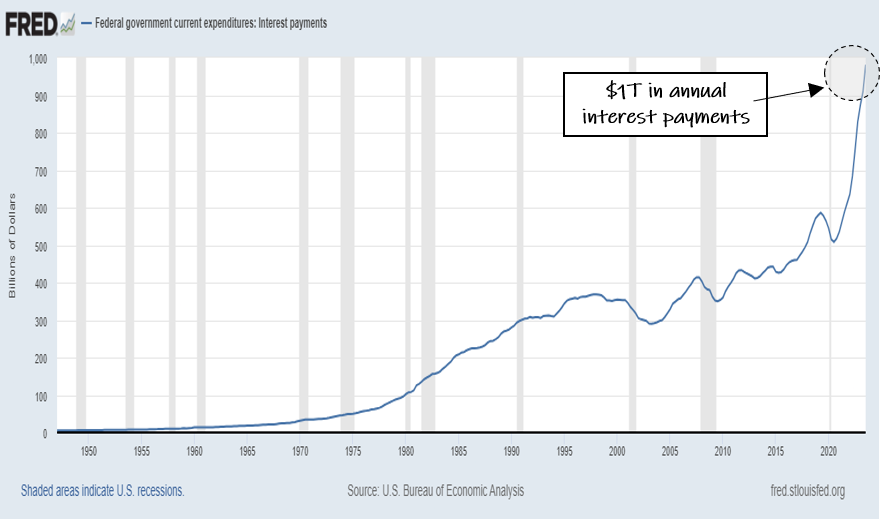
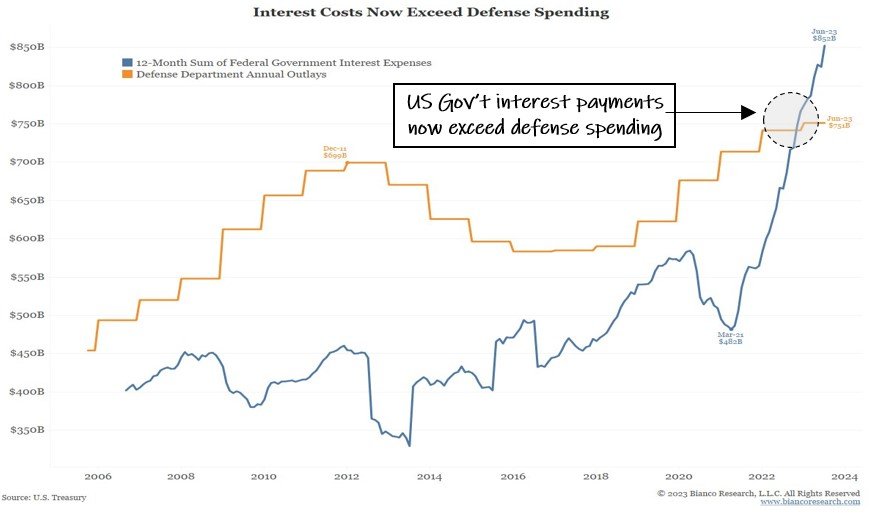
While a debt trap scenario tends to chasten households, it almost seems to be a goal for the US government which has resorted to wartime-level spending to prop up GDP since 2020 (slide 1). Like many US households, the government is pulling this spending forward by borrowing from the future and the tab is mounting fast. At $1 trillion per year (slide 2), interest on the national debt already eats up a third of tax receipts and is now larger than the entire defense budget (slide 3). As these painful tradeoffs grow, US government borrowing could run into a political limit before a technical one.
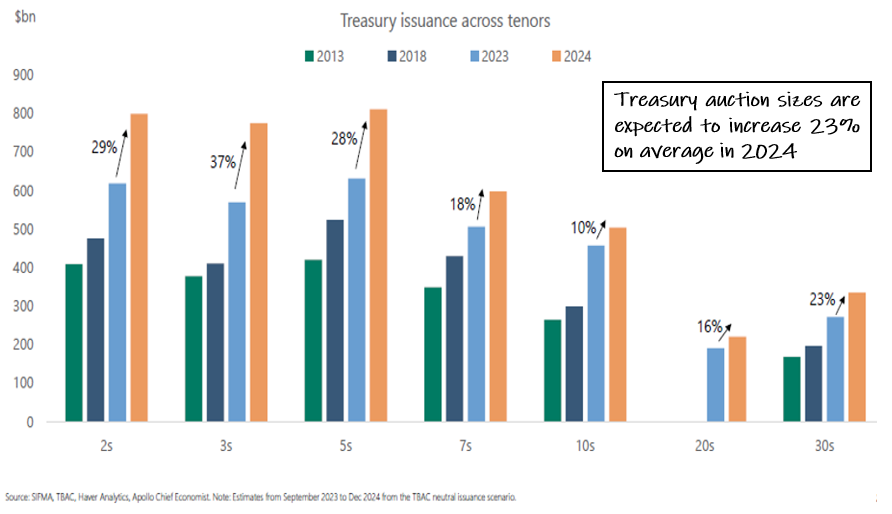
Despite assurances to the contrary from those with the most to gain, the market is naturally starting to call the viability of these astounding figures into question, most concerningly with a nearly failed 30-year Treasury bond auction during the height of this fall’s interest rate spike in October. Between next year’s anticipated $2T deficit and existing debt that needs to be rolled over, Treasury issuance in 2024 is expected to be roughly $10T across increasingly large auction sizes (slide 4). Even if this debt continues to find buyers, it will become an increasingly massive economic anchor as government expands at the expense of the productive economy.
Corporates
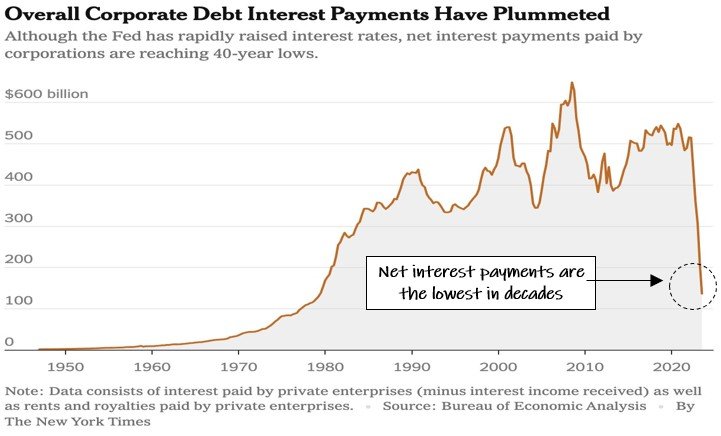
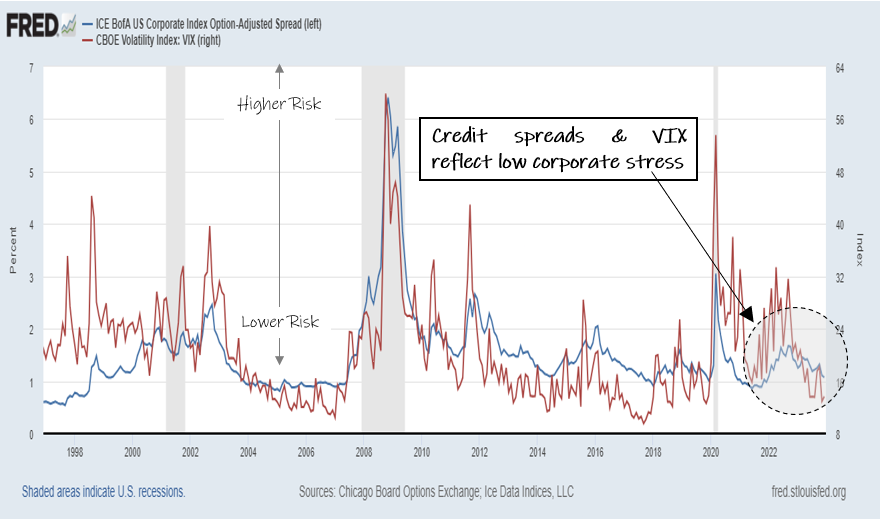
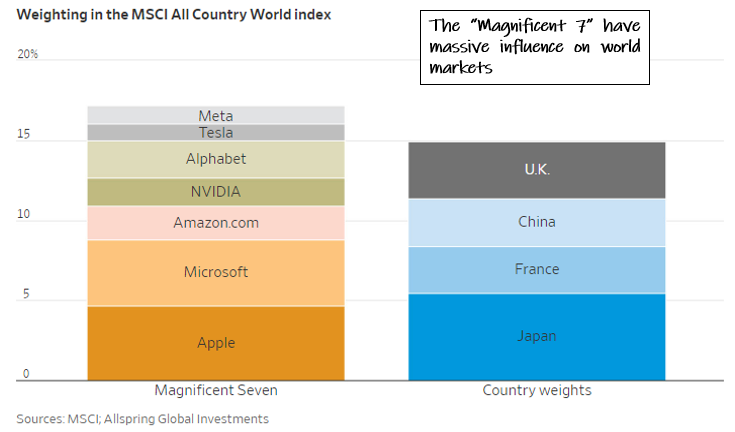
Still flush with cash from low-interest debt issued in the pre-inflation era, rate hikes have so far created a huge windfall for corporations that have seen net interest payments (interest payments less receipts) plummet (slide 1), capping perceptions of corporate risk in credit spreads and the VIX over the past two years (slide 2) despite a policy shock that would ordinarily increase both. Given their strong debt ratings and massive cash horde, this effect is especially pronounced in the “Magnificent 7” which has grown to preposterous proportions and now commands a higher weighting in the MSCI World Index than all of the stocks in the UK, China, France and Japan combined (slide 3).
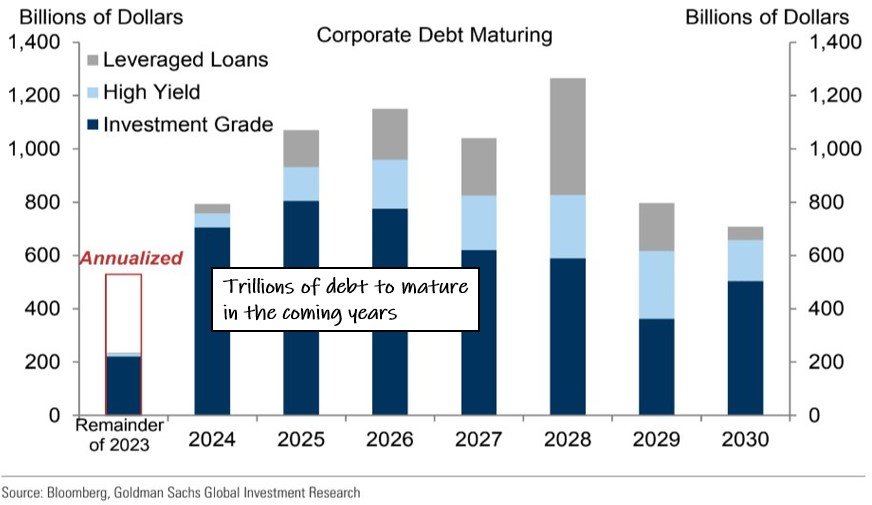
Of course, trees don’t grow to the sky. After creating stability for nearly two years, this positive “carry trade” is set to come to a close as trillions in old, cheap debt matures in the coming years and must be replaced (slide 4). At prevailing rates, this is likely to cause corporate interest payments to spike, sending the whole process in reverse with unknown spillover effects into credit spreads and the VIX.
A fork ahead
In response to the Fed’s suddenly dovish tone at its last meeting in December, markets have staged a strong year-end rally on expectations of a series of rate cuts in 2024. Expected to begin as early as March, these highly-anticipated rate cuts represent a major fork in the road with vastly different destinations depending on the surrounding economic circumstances (chart). In either case, flexibility will be the key for investment success as this cycle plays out in the coming months.

Positive Scenario: Expansionary Cuts
In a market-positive scenario, rate cuts are deployed proactively before growth has turned negative, creating a fabled “soft landing” that supports corporate earnings and creates a broadening stock market rally accompanied by a low and stable VIX index and a steep VIX futures curve that keeps TCM portfolios in their most pro-beta postures.
In this scenario, bullish signals from the VIX should help to keep hedging expense low and index exposure high for Risk-Managed Indexing portfolios, while Alpha Seeker would likely look to the same playbook that produced its market-beating return in 2017’s record-low VIX environment.
Negative Scenario: Recessionary Cuts
In the market-negative scenario, rate cuts are used in response to a rapidly deteriorating economy or even worse, to an acute market issue that threatens financial stability. In this environment, rate cuts are “too little, too late” and can foster a sense of panic that leads to a sustained inversion in the VIX futures curve and the most extreme VIX levels, as seen in the crisis periods in 2020 and 2008.
Under these conditions, Alpha Seeker is designed to go on the attack using long VIX and/or short equity exposures while Risk-Managed Indexing strategies likely move to their most hedged configuration with the goal of insulating portfolios or even profiting from the most acute phase of the crisis. As witnessed in 2020, these intense periods can produce many years’ worth of alpha for TCM portfolios.
Historically, stock indexes have enjoyed a general rising trend punctuated by sharp crisis periods that present tremendous opportunity for VIX exposures. If each of these is only a matter of time, then it is TCM’s philosophy that a portfolio of index exposure with crisis VIX hedging should outperform in the long run. Over the past decade, this has been proven out by TCM’s results and if history is any guide, the next few years could well be outstanding ones.