
Introducing the Vol Dash by TCM, a weekly update on markets and positioning through the lens of TCM’s Volatility Dashboard.
Vol Dash for week ended 3/20/26
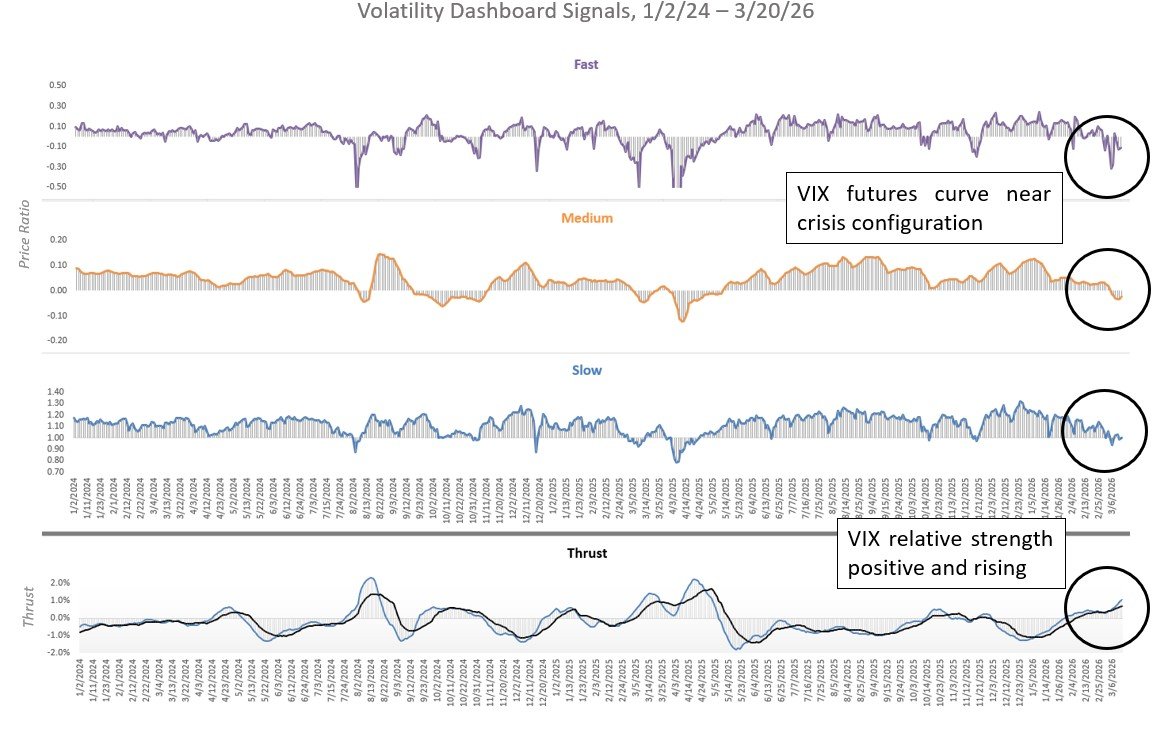
Volatility conditions were little changed last week as continued conflict in Iran and a "hawkish hold" from the FOMC dragged the S&P 500 under its widely watched 200-day moving average for the first time since the "Tariff Tantrum" one year ago.
Now facing what Goldman Sachs calls the largest oil supply shock in history, the S&P 500 has sold off a relatively modest 5.4% since the Iran conflict began with 1-month realized volatility around 13% as of Friday 3/20, a fraction of last spring's readings north of 50%. Meanwhile, hedging demand has pushed VIX prices noticeably higher, creating a large spread between implied (expected) and realized (actual) volatility that will eventually narrow with a jump in realized volatility, a drop in the VIX, or some combination of the two.
In short, while stocks appear to be focused on an imminent de-escalation in Iran, current VIX prices may be hinting at even more formidable risks already set in motion by this year's historic energy shock and very often, such differences of opinion are not resolved quietly.
TCM Volatility Dashboard Signals 1/2/24 - 3/20/26. Source: TCM. Click for larger image
Exposure Update for week ended 3/20/26
In response to the wide implied - realized volatility spread, Tactical Beta and Tactical Q took partial profits on VIX positions last week and on Friday, applied hedges against weekend headline risk via short index positions or in eligible accounts, via index put positions.
Tactical Beta daily exposure, trailing 100 day as of 3/20/26. Source: TCM. Click for larger image
Tactical Q daily exposure, trailing 100 day as of 3/20/26. Source: TCM. Click for larger image