
Introducing the Vol Dash by TCM, a weekly update on markets and positioning through the lens of TCM’s Volatility Dashboard.
Vol Dash for week ended 3/27/26
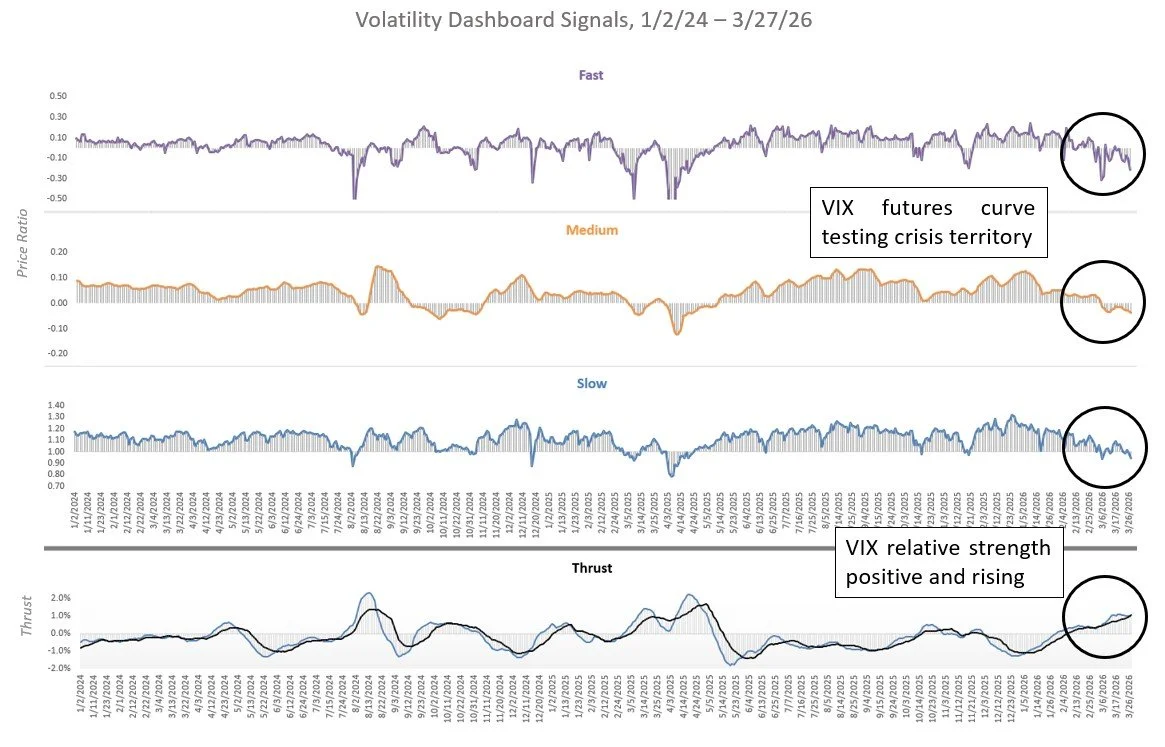
After Monday's "Iran hope" rally fizzled and stocks closed at the low of the week by Friday, Dashboard signals slipped into crisis territory last week as VIX Thrust (relative strength vs a proprietary benchmark) remained in positive territory.
With realized volatility barely in the mid-teens, the S&P 500 has been remarkably composed throughout this correction while a comparatively large jump in VIX hints at a "hedge and hold" mentality, presumably in anticipation of an imminent off ramp in the Iran conflict. While this was a fairly good template for last year's tariff standoffs, the situation in Iran appears significantly more complicated with an oil price shock that embeds itself deeper every day into inflation and interest rates in a process that threatens to morph into a growth scare if not contained soon.
TCM Volatility Dashboard Signals 1/2/24 - 3/27/26. Source: TCM. Click for larger image
Exposure Update for week ended 3/27/26
Mirroring the decay in Dashboard signals, Tactical Beta and Tactical Q exposure has grown gradually more defensive during this month's correction using a combination of short index and long VIX hedges with some tactical VIX profit taking. If conditions worsen, both strategies have room to increase VIX exposure toward a maximum policy weight of 30%.
Tactical Beta daily exposure, trailing 100 day as of 3/27/26. Source: TCM. Click for larger image
Tactical Q daily exposure, trailing 100 day as of 3/27/26. Source: TCM. Click for larger image