
shuffle MODE
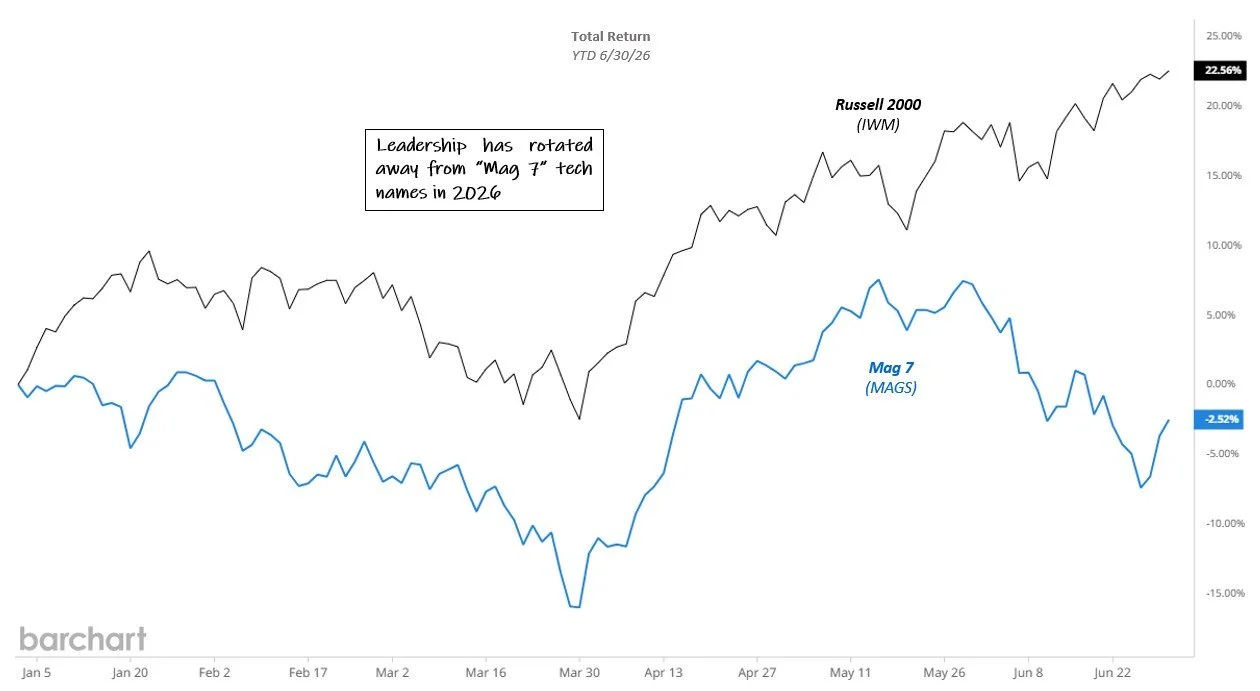
Markets were reshuffled in June as questions around the durability of AI-led gains weighed on large-cap indexes, with the Nasdaq 100 declining 0.2% and the S&P 500 falling 1.0%. Small caps, however, showed notable strength, with the Russell 2000 gaining 3.7%. This divergence suggested that investors were not abandoning risk assets altogether, but reallocating within equities.
YTD 2026 return. Source: barchart.com. Click for larger image
The AI trade continued to exert a strong influence, though with a more discerning tone. Blowout earnings from Micron Inc. (MU) reinforced the long-term infrastructure story, but the month also highlighted the risks of crowded leadership, elevated valuations, and supply bottlenecks. Rather than a straightforward continuation of last year’s “Mag 7” growth trade, the market in 2026 has begun to differentiate more clearly between companies directly benefiting from AI demand and those facing rising costs, stretched expectations, or crowded positioning.
Taken together, June was best understood as a period of internal adjustment rather than outright disruption. For volatility markets, that distinction matters. When weakness is concentrated in one area and offset by strength elsewhere, index-level volatility can remain relatively subdued even as the market feels choppy beneath the surface.
In June, this dynamic produced a jumpy but rangebound VIX environment. For TCM strategies, that translated into modest “insurance premiums” as preliminary defensive positions were deployed to protect against a potential left-tail event that ultimately did not materialize. While these episodes can create modest drag, we view that cost as part of the process of maintaining a tactical response mechanism rather than relying on a static, always-on hedge.
the art of staying invested
Rather than seeking to outperform in every correction, the objective of this process is broader: participate when markets advance, respond when risk rises, and avoid the chronic drag often associated with static hedging. By applying this framework for nearly a decade, Tactical Beta has produced strong long-term results within the hedged-equity space.
The most recent two-year period provides a useful example. Over this period, Tactical Beta has captured a substantial portion of the S&P 500’s strong rally while reducing the benchmark’s maximum drawdown by roughly 740 basis points, with materially lower volatility than the S&P 500 and a stronger full-period return than the hedged-equity peer group* (chart).
*Equal weight composite of JP Morgan Hedged Eq (JHEQX), Swan Def Risk (SDRIX) and Gateway Fd A (GATEX), rebalanced monthly.
Cumulative return with capture ratios, two year period ended 6/30/26. Shaded areas denote S&P 500 peak to trough drawdowns greater than 8%. Source: TCM, barchart.com. Click for larger image
Not just an isolated example, similar evidence appears across multiple measurement windows. Across the trailing 1-, 3- and 5-year periods, as well as since inception, Tactical Beta has generally delivered a higher-return, higher-participation profile than the hedged-equity peer group, while maintaining lower volatility and/or shallower drawdowns than the S&P 500 over the longer full-cycle periods. Like any strategy, the results are not uniform across every window but taken together, the data support our core view that tactical hedging offers one of the most efficient ways to access equity markets.