
TURN TAIL
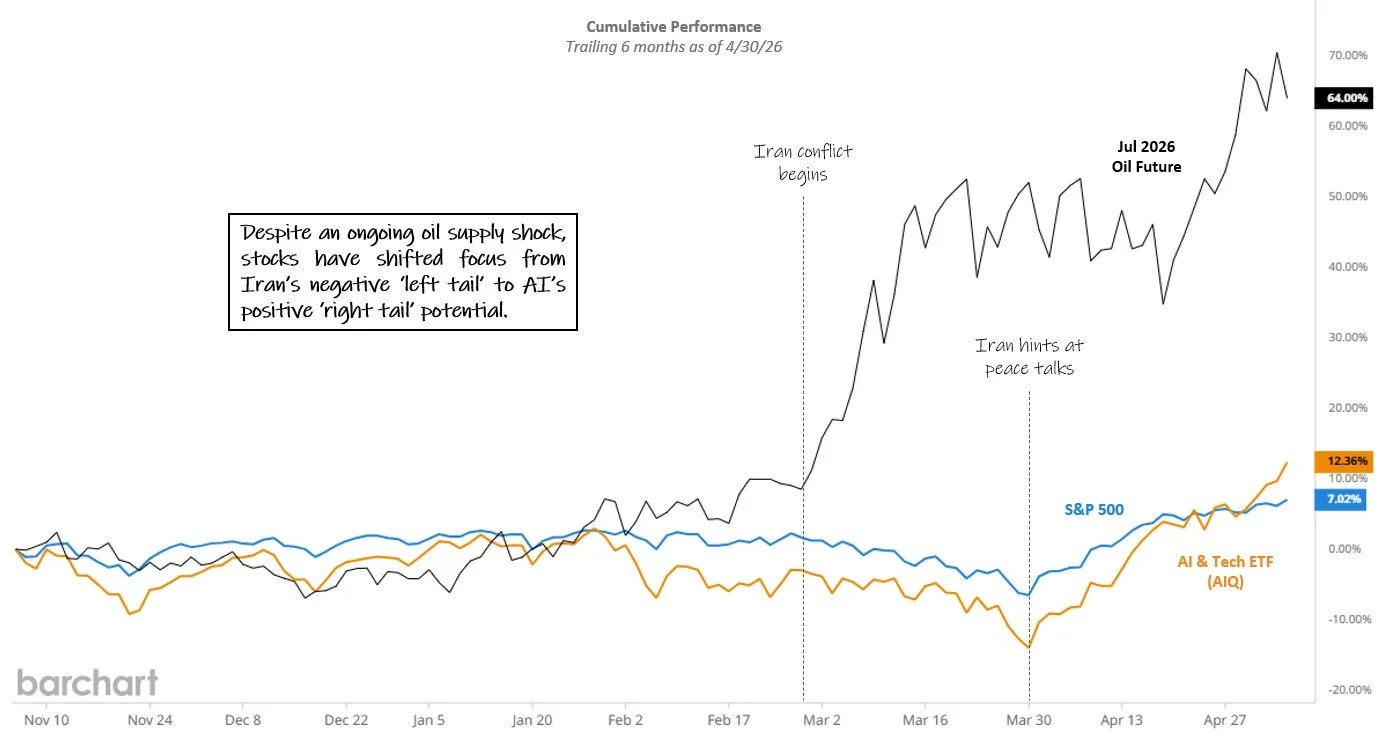
With the negative 'left tail' clipped by the start of peace talks with Iran, a rush back to AI’s 'right tail' potential sent the Nasdaq 100 (+15.6%) and S&P 500 (+10.5%) indexes soaring to record highs in April despite $100 oil in an outcome predicted by approximately zero experts.
Six month return as of 4/30/26. Source: barchart.com. Click for larger image
While static strategies watched hedges turn into anchors, tactical risk management proved its worth again in April with all TCM strategies keeping pace with their respective indexes in the best month since inception for Hedged Yield (+6.4%) and Tactical Q (+13.5%), the second or third best month since inception for Legacy Navigator (+9.1%), Emerging Mkts Smart Index (+10.5%) and Tactical Beta (+8.9%), Hedged Disruptor (+9.0%) reaching a +35% one year gain and the best month in nearly five years for Alpha Seeker (+3.1%).
Caught between an AI boom that could supercharge the economy and an energy crunch that could drag it down, uncertainty now seems to be the only certainty. On the energy front, the real gamble is how long markets will buy the narrative of a "transitory" supply shock while on the AI side, important questions remain around returns on investment and valuation multiples.
In this environment, any bold prediction is likely to be stress-tested, sometimes brutally so. The danger isn't just being wrong; it's the expensive emotional pivot that follows when a concentrated bet goes south. While aggressive risk-taking can have a place in corners of a portfolio, it’s usually a terrible fit for the core. Here, we believe the heart of your strategy demands a tactical, disciplined approach rather than a high-stakes roll of the dice.
Dependable by Design, Dynamic by Nature
Historically, capturing market returns has required accepting full market risk but for nearly a decade now, Tactical Beta has been challenging this status quo with a dynamic risk management approach that has generated over 100% of the S&P 500’s return since inception while maintaining lower volatility and shallower drawdowns.
To be sure, repeating this over the next 10 years will require occasional crisis periods- high volatility, high correlation market declines where the cost/benefit tradeoff of hedging is most attractive. These conditions were last seen during the COVID era when Tactical Beta far outpaced hedged equity competitors with a +19.5% gain in March of 2020 while the S&P plummeted -12.3%.
Since that tumultuous period, the S&P 500 has risen approximately 171% with only six closes over 40 for the VIX Index, most of which coincided with Tactical Beta’s best hedging outcomes in early April 2026. In these non-crisis periods, TCM’s focus turns to minimizing the performance drag of hedging and here the strategy has been very consistent, outperforming hedged equity peers* in nearly 90% of all positive 1-year periods for the S&P 500 since inception (chart).
*Equal weight composite of JP Morgan Hedged Equity (JHEQX), Swan Def Risk (SDRIX) and Gateway Fund A (GATEX), rebalanced monthly.
Tactical Beta outperformance vs peers, positive S&P 500 periods Nov 2016 - Apr 2026. Source: TCM, barchart.com. Click for larger image
In the latest example, heavy-handed hedges created enough underperformance in April alone to wipe out the entire down month benefit accumulated over the prior three years for hedged equity heavyweight JP Morgan Hedged Equity (JHEQX)^. Every hedge presents potential opportunity cost in rising markets, but TCM aims for something more efficient.
Since 2016, Tactical Beta has proven that safety doesn’t have to mean stagnation. While defending against true threats is worthwhile, TCM believes that far too many investors sabotage themselves by paying for protection they don't need with a bill that quietly but consistently comes due in bull markets. While this creates reliably underwhelming results for statically-hedged approaches, Tactical Beta has distinguished itself as a dependable vehicle for capturing market returns—equipped with guardrails, not anchors.
^7.0% underperformance vs S&P 500 in April compared to 6.6% cumulative outperformance in S&P 500 down months over the past 36 months.