
Introducing the Vol Dash by TCM, a weekly update on markets and positioning through the lens of TCM’s Volatility Dashboard.
Vol Dash for week ended 7/17/26
The S&P 500 took a breather last week, declining 1.6% as weakness in AI and semiconductor shares weighed on the broader market. After a strong stretch for equities, the pullback looked less like a wholesale retreat from risk and more like a reassessment of crowded stock market leadership ahead of a heavy earnings calendar including a key report from Google (GOOGL) on Wednesday that could reverse or accelerate the rotation from AI sensitive stocks.
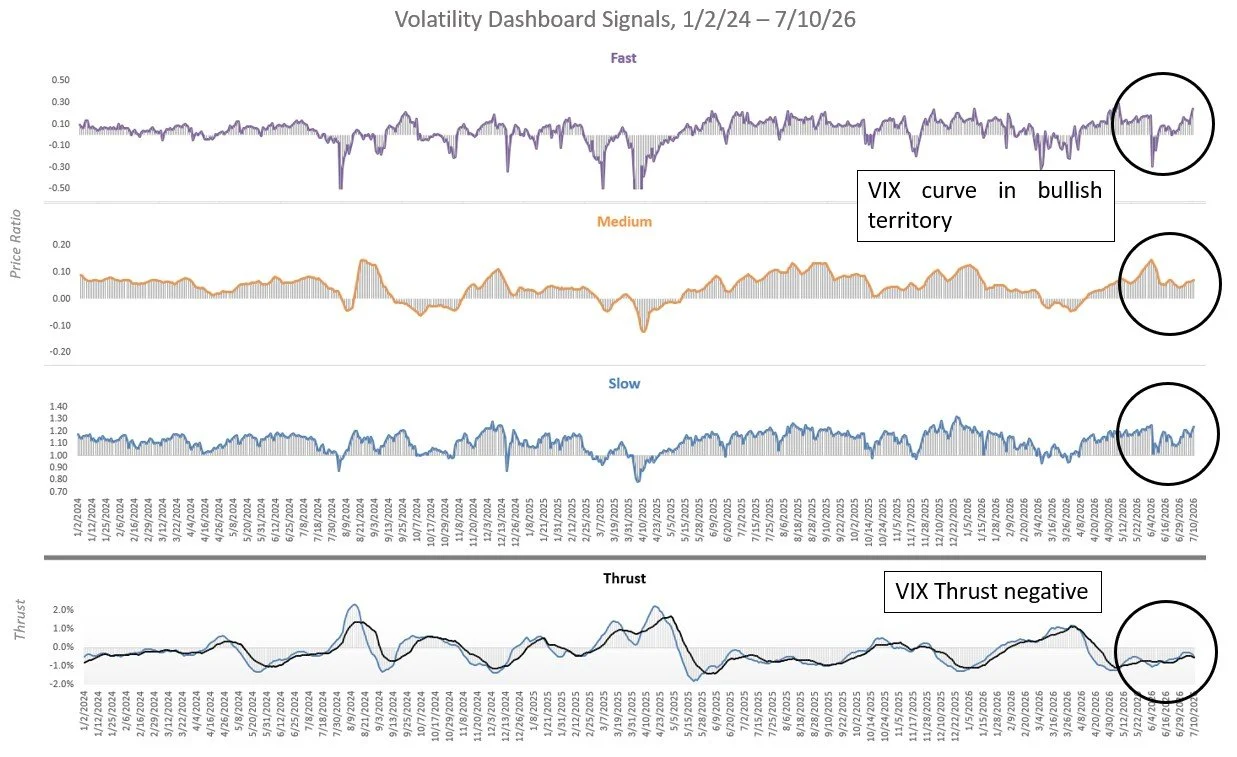
While Dashboard signals turned less bullish last week, they remained well short of crisis territory, with VIX markets appearing to confirm a narrative of rotation rather than broader market stress. That could change, of course, if correlations begin to rise and weakness spreads more broadly across the market. A tactical hedging framework is built for these shifts—not to predict every pullback, but to respond when the cost/benefit tradeoff for protection begins to improve.
TCM Volatility Dashboard Signals 1/2/24 - 7/17/26. Source: TCM. Click for larger image
Exposure Update for week ended 7/17/26
Tactical Beta and Tactical Q increased equity exposure toward 107%, viewing the equity pullback as an opportunity while the Dashboard remained in bullish territory.
Tactical Beta daily exposure, trailing 100 day as of 7/17/26. Source: TCM. Click for larger image
Tactical Q daily exposure, trailing 100 day as of 7/17/26. Source: TCM. Click for larger image