
Introducing the Vol Dash by TCM, a weekly update on markets and positioning through the lens of TCM’s Volatility Dashboard.
Vol Dash for week ended 7/24/26
The S&P 500 fell modestly last week as renewed U.S.–Iran tensions created a combination of higher energy prices, renewed inflation concerns and rising bond yields that weighed on equity valuations. Once again, technology was particularly weak as investors questioned whether the earnings generated by artificial intelligence will justify the sector’s enormous capital spending; the Nasdaq Composite declined 2.1%, while a sharp selloff in the Magnificent Seven tech giants contributed to broader market weakness.
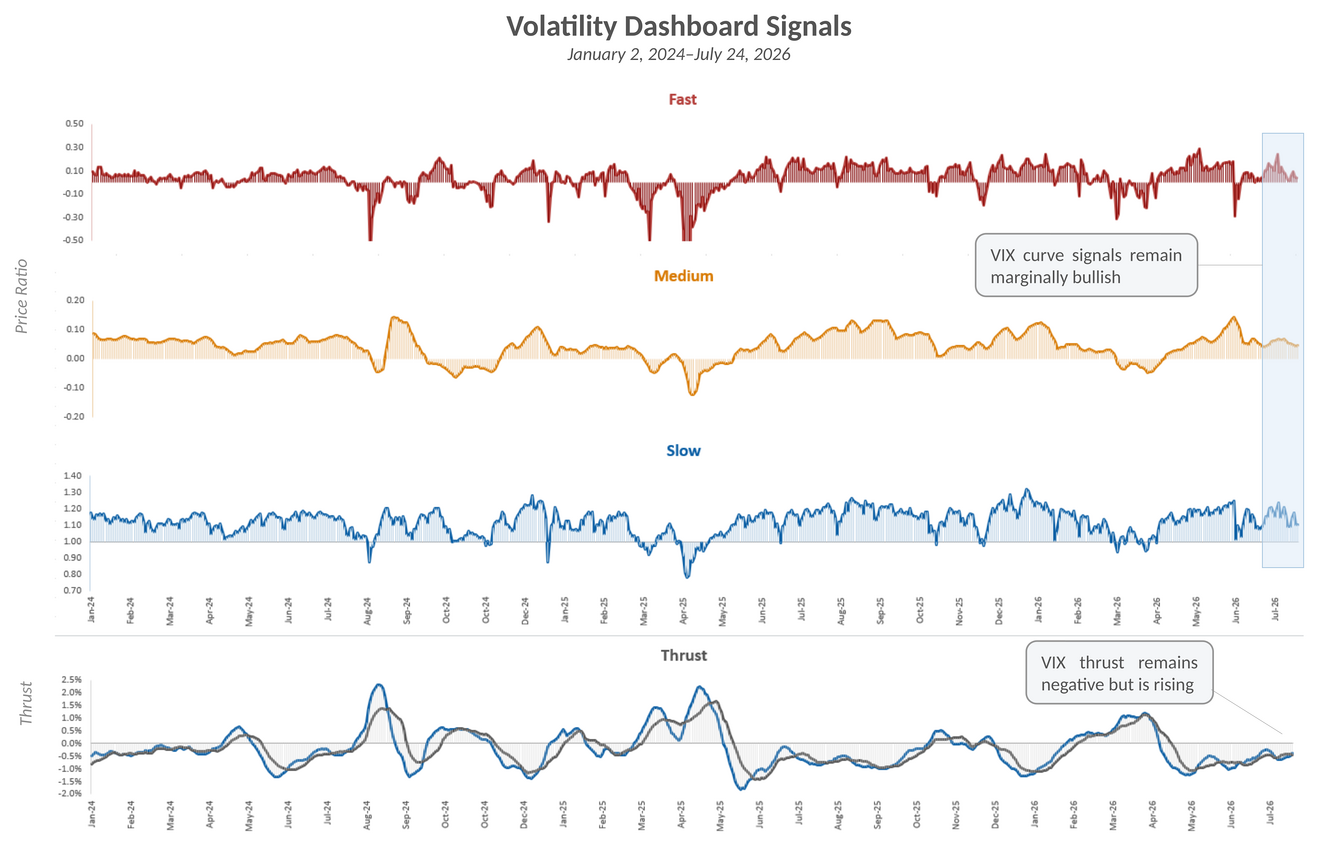
With sector rotation keeping a lid on index-level volatility, the VIX settled nearly unchanged on the week with some flattening in the VIX futures curve suggesting increasing demand for hedges. With the VIX index at 18.6 and 20-day realized S&P 500 volatility near 10.4%, implied volatility currently retains a meaningful premium—evidence that investors are starting to pay for protection despite the absence of outright market stress.
This week brings a dense catalyst calendar: the Federal Reserve’s meeting on Wednesday, second-quarter GDP and PCE inflation data, and earnings from roughly one-third of the S&P 500—including several major technology companies—could determine whether last week’s weakness develops into a broader risk-off move or proves to be another temporary reset.
TCM Volatility Dashboard Signals 1/2/24 - 7/24/26. Source: TCM. Click for larger image
Exposure Update for week ended 7/24/26
With the market pullback occurring against a backdrop of sector rotation and bullish Dashboard signals, Tactical Beta and Tactical Q remain moderately overweight equity indexes for now.
Tactical Beta daily exposure, trailing 100 days through 7/24/26. Source: TCM. Click for larger image
Tactical Q daily exposure, trailing 100 days through 7/24/26. Source: TCM. Click for larger image