

Earnings steady the market as volatility retreats
Stocks rose last week in a back-and-forth pattern that saw markets initially struggle with the Federal Reserve’s "hawkish hold" on Wednesday before a late-week recovery driven by well-received earnings reports from Microsoft and Amazon.
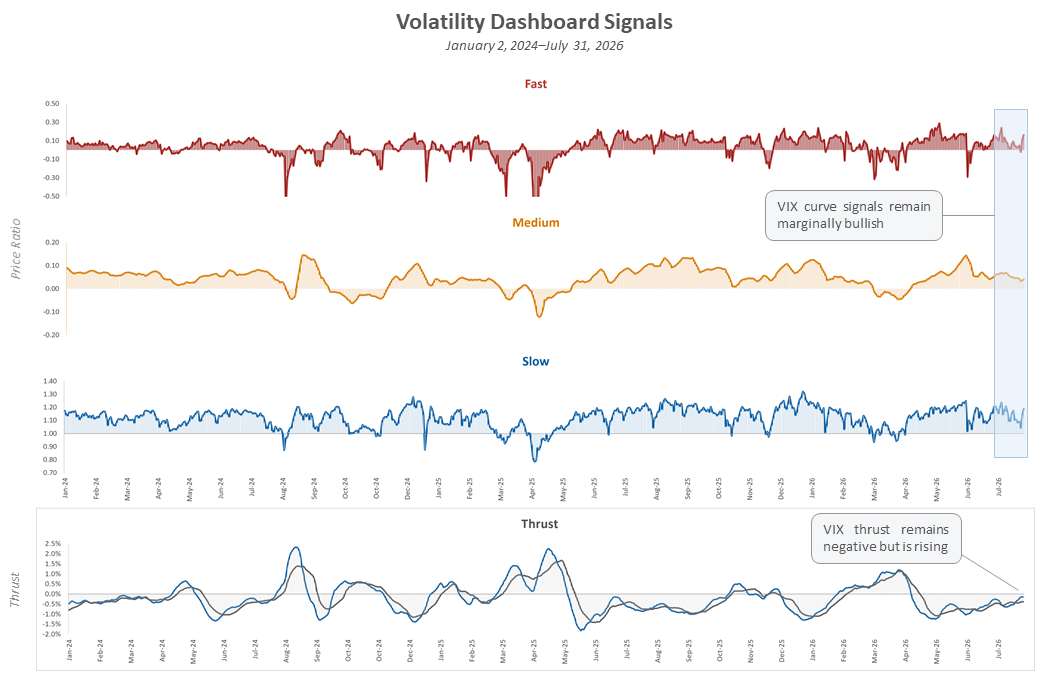
After briefly reaching a closing high above 20 on Wednesday, the VIX ended lower on the week with the VIX futures curve remaining in a bullish contango (upward-sloping) formation and the VIX index about 3.5 volatility points above recent realized movement in the S&P 500. That spread and the upward-sloping curve suggest that broad-market stress remained contained, even as investors continued to pay a premium for protection against specific risks.
This week brings the ISM* surveys, Tuesday’s JOLTS^ report, and Friday’s July employment report as well as earnings from AMD that should provide an additional read on AI investment.
*ISM surveys measure business conditions in the manufacturing and services sectors based on responses from purchasing managers. Readings above 50 generally indicate expansion, while readings below 50 suggest contraction.
^JOLTS—the Job Openings and Labor Turnover Survey—tracks job openings, hiring, quits and layoffs, offering insight into labor-market demand and worker confidence.
TCM Volatility Dashboard Signals 1/2/24 - 7/31/26. Source: TCM. Click for larger image
Exposure Update for week ended 7/31/26
Tactical Beta and Tactical Q remain modestly overweight equity index exposure while Dashboard signals remain bullish.
Tactical Beta daily exposure, trailing 100 days through 7/31/26. Source: TCM. Click for larger image
Tactical Q daily exposure, trailing 100 days through 7/31/26. Source: TCM. Click for larger image